What’s New
 R Markdown Reports On Demand with MobileTriggerR markdown is great for building reports that are easily re-rendered based on new or evolving data. But when you're… ...
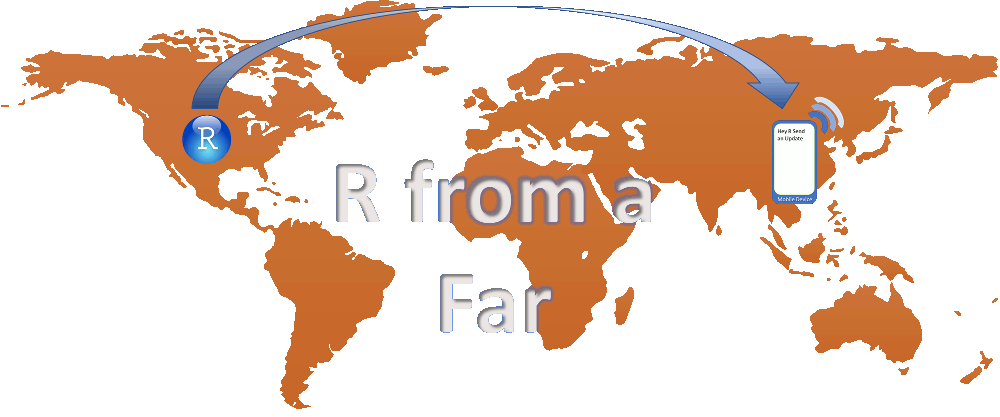 MobileTrigger Setup: Run R Scripts, Models, Reports with Mobile DeviceSay hello to the MobileTrigger package. With it, you can run R scripts, models, and reports from a mobile device… ...
 MailR SMTP Setup (Gmail, Outlook, Yahoo) | STARTTLSThe mailR package allows you to easily send e-mails with R, but you need the right mailR SMTP settings. Getting… ...
The Conversation @ R-bar.net
We explore topics related to R and its applications in science, engineering, and data processing. Occasionally, we’ll stray outside R the universe into other spaces, but for the most part the topics we’ll frequently visit include:

Quality Control
Everyone knows quality when they see it, but the description is often difficult to put in words. The definition of quality depends on who you are – the customer or the vendor. As a vendor, quality is about making what the customer needs, feeling confident in the product you are delivering, and getting orders for more product rather than complaints. If you’re thinking – “I hope that 10 year product last more than a week”. Something is wrong. As the customer, I want to know the product I just paid for meets my needs, does its job well over the quoted lifetime, and helps me grow my business. If the product can do this, I’ll need more of my vendor’s quality products, goods and services to expand my business.
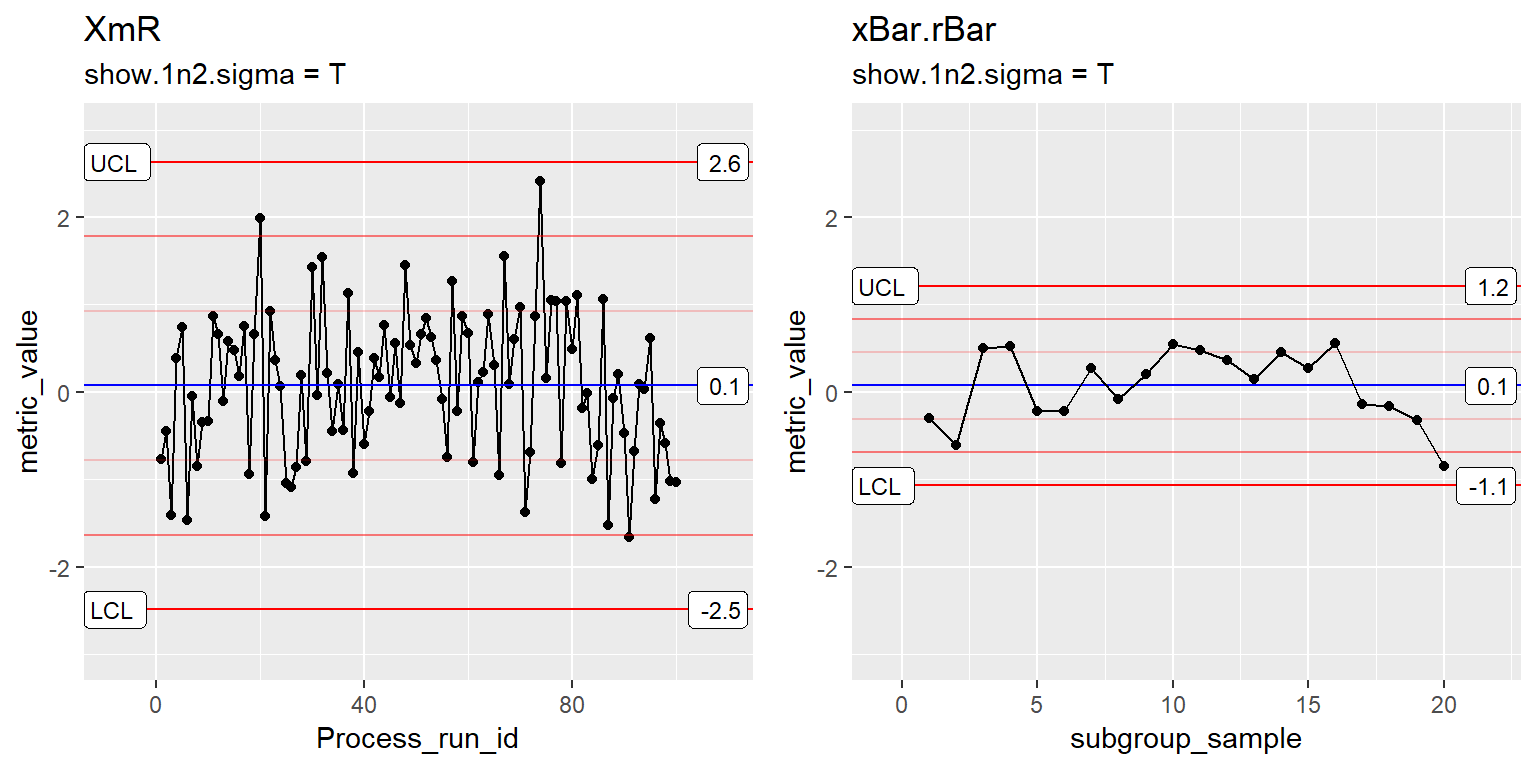 For customers and vendors, control charts are a great way to get a grasp on quality. For the vendor, control charts allow you to monitor your process and answer tough questions like, “Is your process on target, stable, and capable of meeting the customer’s needs?” If you have a lot of rework and angry phone calls, the answer to these questions is likely no. Control charting may help you improve your product quality. Making quality control charts with R is simple. Get started today using the ggQC package.
Install ggQC
1 | install.package("ggQC") |
1 | devtools::install_github("kenithgrey/ggQC") |
v0.0.31 fixes the following 0.0.3 issues:
- a y-axis scaling bug associated with drawing the 1n2 sigma lines on the QC charts.
- a strange ggplot bug around the word color and colour.
Programing
R is different than C, python and other notable languages. For example
- Variables are assigned with “<-” rather than “=”.
- R is an **interactive** functional language. You can’t compile scripts, but you can run them headless.
- To work efficiently, you should think in terms of sets and vectors (fast) and avoid for() loops (they’re slow).
- R is biased towards statistical data processing.
So with such differences, how popular is the R programing language? According to IEEE Top 2018 Programing Languages, R is ranked number 7 “by the typical IEEE member and spectrum reader”, just behind PHP and above JavaScript. That position among these notable web scripting languages is no doubt a function of R’s awesome community, 10,000+ packages to help you get your work done, and the fact that its completely free.
While biased towards statistical data processing and analysis, the R language is capable of so much more than stats and data mining. In my work, I’ve used it to make simulations and GUIs, scrape file systems and websites, work with binary files, interact with SQL databases, query remote tools. But, what really makes R standout is its emphasis on helping you communicate.
Ways R Helps You Communicate
- Plots: The sky is the limit with the type of plots you can make in R using base graphics, RGL (3D), ggplot, and lattice. (Warning – Always remember you are not the only one who needs to understand the fancy plot. Keep it simple whenever you can for maximum impact.)
- Interactive User Interfaces: With R shiny you can quickly make responsive user interfaces so your customers can play with models or even raw data. Your customer won’t need to know R.
- Make Reproducible Reports: rmarkdown allows you to make pdfs, html docs, word documents and recently power point presentations that can change as you update your code. rmarkdown can even be used to write complete websites. As an example, see the ggQC documentation site.
- Code Documentation: documenting new packages is a breeze with the roxygen2 package.
Even after 6 years of using the R programing language, I continue to learn new capabilities. To be a part of that learning, check back with R-bar.net often or follow on twitter
Learning
Back in 2012, I had committed to learning R and getting a deeper understanding of statistical methods.This was to support me in my quality control, process engineering and modeling roles at work. I choose R because I didn’t want to worry about learning a new statistical tool in the future. R is free. It could follow me wherever my career led. So, I downloaded R and was greeted by its welcoming (sarcasm) out-of-the-box GUI.
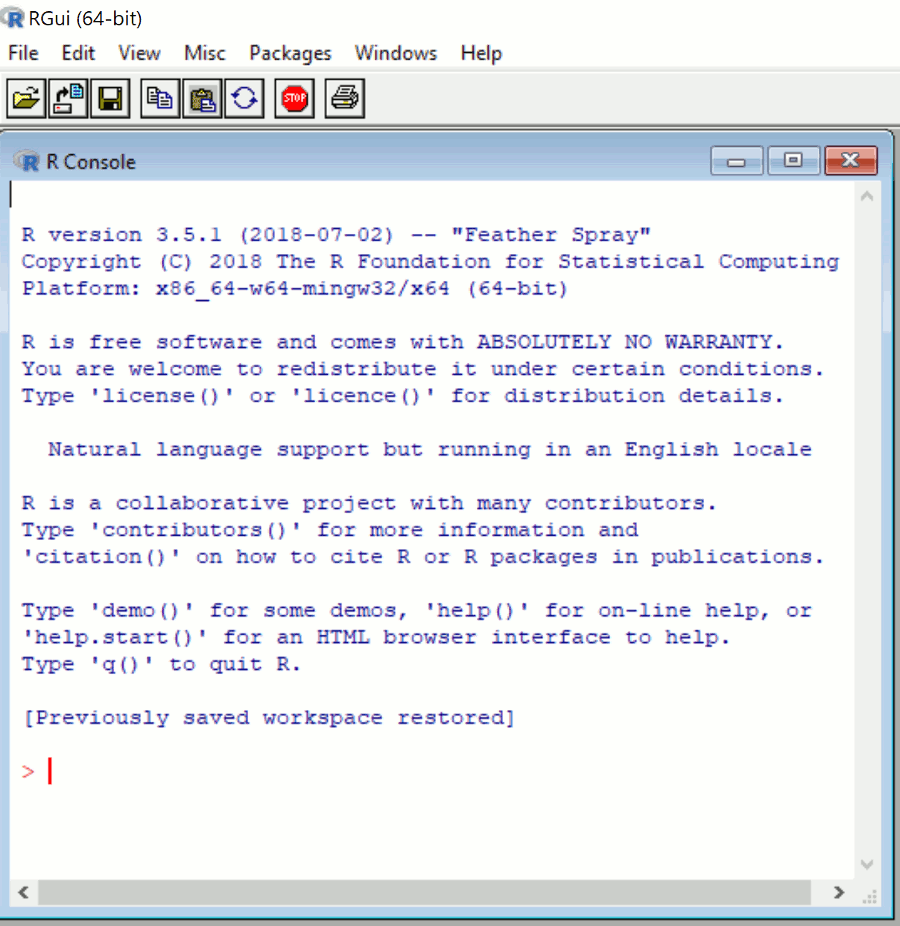
Now if you’ve had this experience. Don’t be afraid. Just close the window, open your browser and download R-studio. Just pretend that out-of-the-box R GUI thing didn’t happen. Cool, you got R installed and you have a nice way to start working with it. But what to do….?
Programming with Purpose
Rather you are learning Chinese, Spanish or the R programing language, its hard to learn any new language without a purpose. Back in 2012, my goal was to relearn stats from an industrial point of view and start applying it. Undergraduate work and a PhD in chemistry didn’t really provide the background I need needed here. Also, a colleague at the time mentioned a cool analytical problem solving method called PCA. I wanted to know what this was all about. So I had a purpose and I had a tool. However, I later found out my colleague was confused or perhaps miss spoke about PCA. Either way, I was motivated.
Diving in With Both Feet
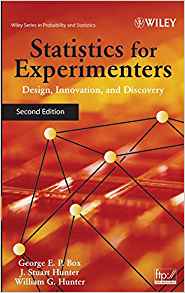
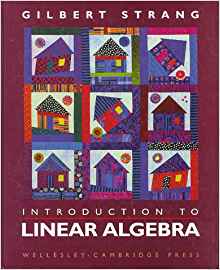
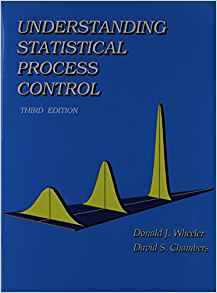
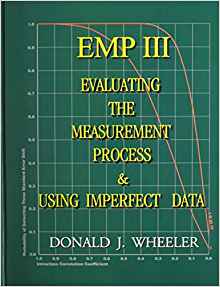
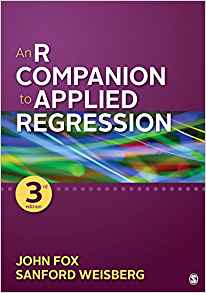
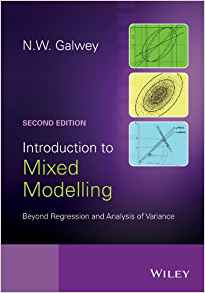
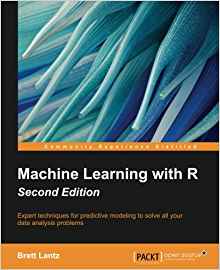
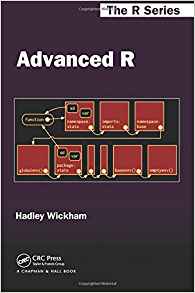
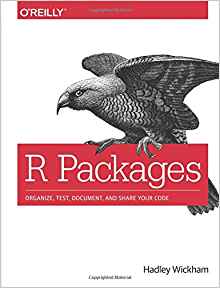
Next I started working through books, ranging from statistics for engineers, linear algebra, machine learning etc. Below are the books that serve as my foundation to stats and learning how to apply R.
In the beginning, 2012, there wasn’t a lot of friendly HOWTOs for basic R or too many of those amazing cheat sheets. I worked my way though the examples in the stat books and made it a point to get the answer with R. When I got stuck, often enough, I’d looked for guidance online at places like stackexchange, stackoverflow, and r-bloggers. For me, learning R has been an organic experience in this way. These days when I learn something new, I relay on R to help me think it through in much the same way Tony Stark (Iron Man) relies on Jarvis.
Its OK to Use Spreadsheet Software
A final note for folks new to R. I’m good with R, and I still use a combination of R and Excel. These days, I could do it all with R but there are times when managing and editing small data tables is simpler and faster with Excel. Like anything else, it depends on what you need. Sometimes you need a airplane, sometimes you need a bicycle. Experience is knowing which tool to use and when.
R for Fun
Ok so, you know R or your in the process of learning it. To keep it fresh you need to explore and have fun with it, for like any language — if you don’t use, you loose it.
When I first started learning R, I was paranoid about loosing what I had worked so hard to learn. Because of that, I used R anyway I could which meant going outside the stat box. So here are few things you can do to keep those skills fresh:
- Help Others: Signup with stackexchange and help some one else with and R issue.
- Think Out of the Stat Box: Can R help solve your next computer problem (e.g., you need to rename 500 files)
- Play with a New Data Set: Check out Kaggel
- Make You Own Package: What can you do to make the R user experience better?
- Learn Something New: Learn something new in social science, or physical science and engineering.
- Become a Better Communicator: Checkout shiny, rmarkdown, github
